The Gentrification Of The Urban Fringe.
Daniel Island, West Ashley, Charleston, and the Demographic Consequences Of Annexation and Development.
Introduction: Daniel Island and Cainhoy.
A few decades ago, a largely rural tract of land lay just outside of Charleston, South Carolina. The southernmost part of this tract, Daniel Island, was almost entirely uninhabited, especially after one Harry Guggenheim bought the land and eventually "expelled the remaining families", to quote a history on the Daniel Island Property site.
Farther north was the former Cainhoy plantation, which I think was actually assembled by Guggenheim from other area plantations, according to an account given by G. Harris Jordan in the "Charleston Mercury". Author Herb Frazier has written on the region: "Since Emancipation, Gullah people of the Cainhoy area have scratched out a living through subsistence farming, timbering, fishing and doing domestic work. Some operated moonshine stills deep within the cover of the thick forest."
As recently as 2000, this tract (literally--tract 204.02 in the 2000 Census) was majority-black, although by then the other Census numbers were not apparently especially rural.
Daniel Island and the Cainhoy plantation have been annexed into the city of Charleston and extensively developed--especially Daniel Island, now an affluent enclave whose website brags of its country club:
(From a staff article in the "Charleston Chronicle": "Many families that didn’t get electricity until the 1950s or indoor bathrooms until the 1970s now are in close proximity to multimillion dollar homes on the rivers and creeks they fished for sustenance.")
The former tract 204.02 has been divided into tracts 204.03, 204.04, 204.05, with the southernmost tract 204.04 more or less Daniel Island. In the most recent estimates, Tract 204.02 boasts a population of 6,441, bearing all the signs of affluent new arrivals: 90% non-Hispanic white, 72% born outside of South Carolina, and with a median household income of $101,771. (A "Post and Courier" article by Schuyler Kropf quotes "local leader" Fred Lincoln: "I go on Daniel Island, I can't find a Southern accent".)
Tract 204.05, the farthest-north, remains 60% African-American, at least for now. The middle tract, with some of the old Cainhoy plantation, has been targeted for further development in a plan that "could be bigger than Daniel Island", according to a "Post and Courier" article by Brenda Rindge, and I don't see any reason it would stop there. (Daniel Island itself is said, in that article, to only be in the first half of a 30-year development plan, and already Daniel Island and the Cainhoy peninsula account for nearly one-fourth of the housing permits issued in Charleston between 2009 and 2014.)
I can't say for sure that every home in all of these developments was sold to white people, but based on the Census estimates, they can't have sold all that many to anyone else (or they did, but it was cancelled out by displacement). The non-Hispanic white population of the tract cluster increased from 1,801 to 10,112 (an increase of 8,311) while the remaining population only increased from 2,829 to 3,083 (an increase of 254). Charleston's own estimates have the population of Daniel Island and Cainhoy within city limits as rising from 1,122 in 2000 to 10,081 in 2013, suggesting that a few thousand people in the tract cluster lived outside the city throughout. Since the areas seemingly most outside of city limits are the less-white northern tracts, the growth within Charleston proper might be even more dramatically white.
"Gentrification" Of An Urban Fringe.
Daniel Island and Cainhoy are extreme examples, but they have helped to shape the population of Charleston.
As discussed in the companion piece to this article, Charleston has experienced significant demographic change over the past thirteen years. The non-Hispanic white population has grown by about 28,000 (or by nearly 50%) while the non-white/Hispanic population has only grown by about 1,700 (or by about 5%), causing the white population to grow from 62.5% of the city to 70%. (A 1994 article had African-Americans at 42% of the city, which is down to 24% today.)
Notably, two-thirds of Charleston's population increase has come from people born outside of South Carolina, who were 37.6% of the city in 2000, up to 44.4% of the city in the ACS 2013 3-year estimates.
When a city or neighborhood grows whiter, wealthier, or more educated, it's often called "gentrification". In the standard narrative of gentrification, part of a city, usually a downtown or an urban core, becomes "cool" and attracts increasinngly affluent migrants, with long-time residents eventually displaced or priced out. An enormous amount has been written about this process, about the extent to which it results from large-scale economic forces as opposed to individual choices or local policy decisions, and so on.
What's happening in Charleston, South Carolina seems to bear some resemblance to the standard gentrification narrative. As a result of some combination of individual choices, broader trends, and municipal policy, the city is attracting migrants, many new to the state itself, and its demographics are changing. Some of this is indeed happening in Charleston's downtown core on the main peninsula, where newer (white) residents do seem to be displacing older (African-American) residents.
The largest growth, though, is happening in the kinds of neighborhoods that don't seem to be studied and discussed as often as trendy downtowns: neighborhoods on the periphery of the city's built-out area, in Charleston's urban fringe. Neighborhoods like Daniel Island and Cainhoy, which might account for as much as 30% of the increase in Charleston's non-Hispanic white population on their own.
In areas like these, Charleston isn't so much displacing longtime residents (although I'm sure many on the Cainhoy peninsula have been or will be displaced) as adding new residents in empty space. It'll be interesting to follow the effects on the city's finances, politics, and culture.
In the rest of this article, I'll map the population shifts in Charleston, sketch the city's annexation strategy, profile the remaining regions of the city, and discuss the effects on the city council.
Mapping Demographic Change in Charleston.
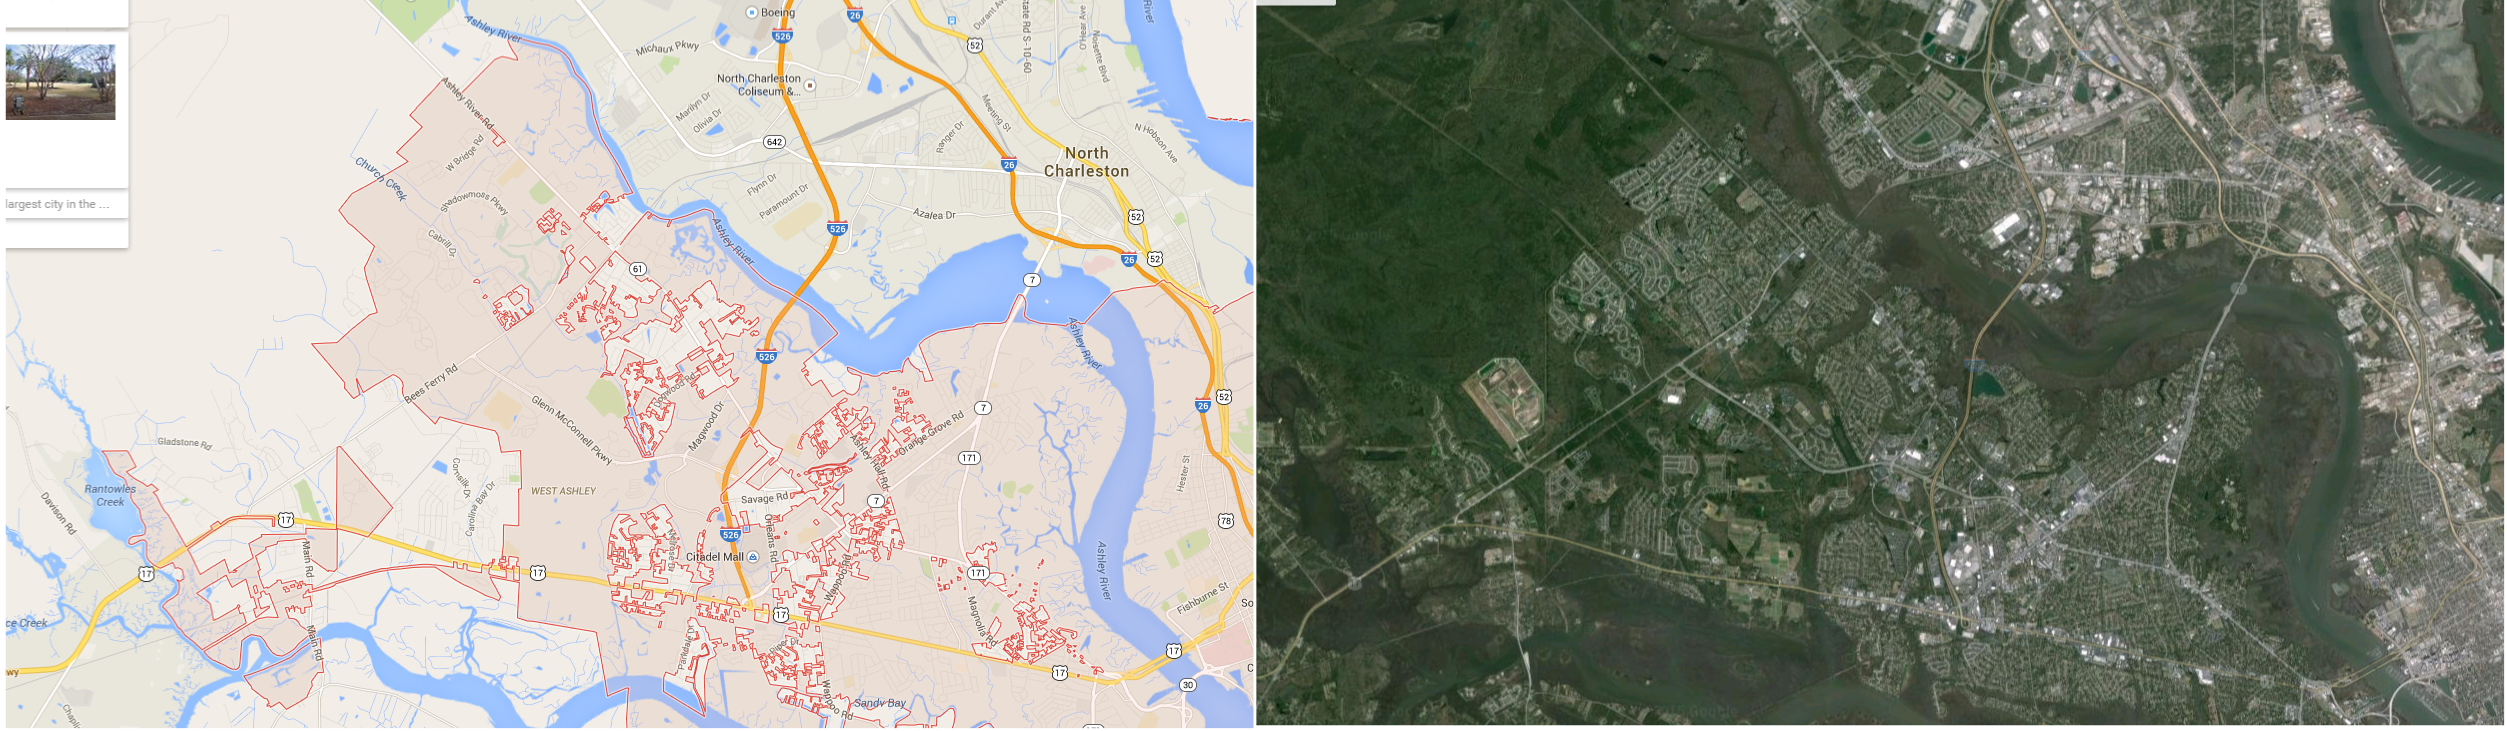
Below are two maps of Census tract clusters in the Charleston area, colored by the absolute increase in non-Hispanic white and minority populations, respectively. Charleston's city boundaries as of 2000 are drawn in yellow, its boundaries as of 2010 are drawn on in blue, and you can easily see the dark red Daniel Island/Cainhoy tract cluster under the city's northeast tendril. Census tracts from 2000 and 2010 have been combined into comparable areas using Matthew Bloch's MapShaper.
Absolute Population Shifts In Charleston, South Carolina Census Tract Clusters, 2000-2013
If you attribute all the growth in them to the parts within city limits, about 60% of the citywide increase in non-Hispanic white populations came from the two darkest clusters touching Charleston proper: the aforementioned Daniel Island/Cainhoy cluster of tracts 204.03, 204.04, 204.05 in Berkeley county (formerly tract 204.02) and the cluster of tracts 56, 57, and 58 in Charleston county (formerly tracts 25.01, 26.09, and 26.10). Between them, the tracts of these two regions had their non-Hispanic white populations increase by a combined 16,556 from 2000 to 2013.
Of course, as you can see on the map, neither tract cluster is entirely within city limits, but it seems like much of the developed area is (see below for one comparison), and Charleston's annexed even more of the West Ashley cluster over the past ten or thirteen years. Several other tracts showing high non-Hispanic white growth, in James Island and Johns Island, line Charleston's jagged western border, which has shifted even farther west in a few places.
On Charleston's City Limits.
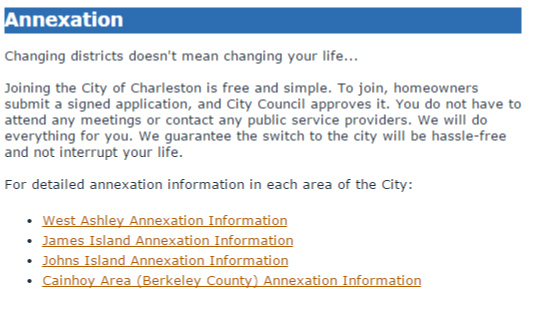
A bit more on that: Charleston's geometrically intricate boundary is a classic signature of sprawl and annexation (if this is unfamiliar to you then take some time to look up the precise city boundaries of Los Angeles, Phoenix, or Columbus.) In fact, Charleston makes it very easy for people in peripheral unincorporated areas to annex themselves into city limits:
The city has been just as eager to annex on larger scales. The long-time Mayor of Charleston, Joe Riley, has pursued an aggressive annexation strategy and "refers to Daniel Island as his Louisiana Purchase", according to a 2006 article in the Daniel Island News by Mary Durben (working from other sources).
According to the Charleston Property blog, in 2006 alone, Charleston annexed some 855 acres, although this seems to be quite a bit more than in most subsequent years. (The city only annexed 86.5 acres in 2011 and 91.6 acres in 2012.) This resulted in a small population gain on its own, but because of the potential for new developments, "the city will eventually gain far more residents than the 2006 annexation numbers suggest. [...] Mayor Joe Riley has said that, ideally, all the properties in unincorporated areas surrounded by the city boundaries will eventually become part of Charleston."
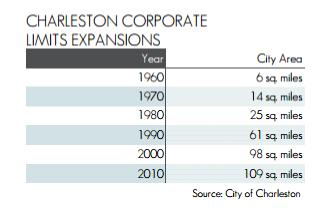
Most of Charleston County seems to be unincorporated west of Charleston, but I'm not sure how much more the city will be able to annex. As you can see from their own land use plan, Charleston's growth in physical area has slowed considerably over the past decade or so:
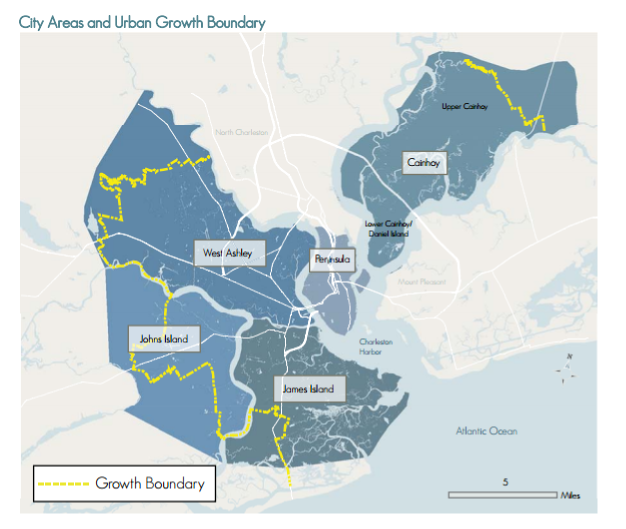
Charleston County also established an Urban Growth Boundary (UGB) near the city's current western border. I am not sure how much of a limitation this will be in practice, although the city professes a desire to make it permanent (the UGB was shifted to accommodate the Long Savannah development mentioned below, for example):
Charleston has also faced some political resistence in trying to expand, apparently especially on Johns Island and James Island to the west and south (where the city runs up against more existing developments than in Cainhoy or West Ashley).
West Ashley.
We've already discussed Daniel Island and Cainhoy, let's discuss West Ashley a bit. Technically, West Ashley refers to everything on the landmass west of Charleston's downtown peninsula but north of James Island and Johns Island. Charleston's own estimates have nearly half of the city living in West Ashley.
Outside of the dark red outer tracts on my map, though I don't see much growth in West Ashley, white or otherwise. The total population of the Census tracts actually shrank a bit (from 49,275 to 48,866) as did the non-Hispanic white population (from 33,236 to 31,623).
As noted above, though, the three outer West Ashley tracts almost doubled from 2000 to 2013: The total population there grew from 13,362 to 24,060, while the non-Hispanic white population grew from 9,652 to 17,897. Again, this is a very large share of the city's total white growth in a single peripheral area.
A note of caution, once again, is that the city limits don't cover all of the developments in this area, although they seem to cover most of them. Comparing my Census tract sums with the city's estimates, I also don't see much or any growth in the population estimated to live in West Ashley's Census tracts but not in Charleston's city limits (16,683 in 2000, 16,180 in 2013):
Unlike the Daniel Island/Cainhoy area, the outer West Ashley Census tracts didn't get much whiter in percentage terms, since both the white and non-white populations grew significantly. Still, even proportional growth in a heavily-white part of the city makes the city whiter as a whole. According to this "Post and Courier" article by Diane Knich, "Lowcountry residents and out-of-state newcomers seeking a warmer climate and better quality of life [have been looking] to outer West Ashley, where housing deals still can be found." (My emphasis.)
More "mega-developments" seem to be on the way: "Long Savannah, the 1,253-acre, mixed-use development that will include up to 4,600 homes, had stalled during the Great Recession, but it could be underway as early as 2016." According to another "Post and Courier" article by Diane Knich, Long Savannah is planned for another of Charleston's tendrils in one of these same three outer West Ashley Census tracts (presumably an area annexed specifically for this development), adding yet more growth to a high-growth region.
"Standard" Gentrification In The Downtown Peninsula?
Charleston was originally limited to the peninsula between Cainhoy and West Ashley, and the peninsula still has the city's urban core. As I'll repeat in the conclusion, I often see the assumption that a city's demographic changes are driven by changes in its downtown neighborhoods.
Downtown Charleston does not seem to be the primary driver of the city's demographic changes, but it certainly is contributing. Unlike with the estimates for Daniel Island and West Ashley, the peninsula's population has stayed fairly constant, but the non-Hispanic white population of these tracts has increased (from 16,736 to 21,002, an increase of 4,266) while the remaining population has dropped (from 20,310 to 16,752, a decrease of 3,558).
Notably, the peninsula apparently transitioned from majority non-white to majority white. The actual numbers are pretty dramatic: The peninsula's Census tracts went from 51.8% African-American and 45.2% non-Hispanic white in 2000 to 38.7% African-American and 55.6% non-Hispanic white in the 2013 estimates.
(The city estimates have a few thousand people in these Census tracts that aren't in Charleston proper, but also shows no growth from 2000 to 2013.)
Perhaps the peninsula's pattern of a constant population with increasing non-Hispanic white and decreasing minority populations suggests displacement and a limited housing supply or capacity--the "standard" gentrification story, as opposed to the development-driven shifts in West Ashley and Daniel Island. The peninsula only accounts for 490 of Charleston's housing permits from 2009-2013, less than half of the 1,168 issued for Daniel Island and Cainhoy (which have far smaller populations), and the second-lowest of the city's five regions. Conversely, the city's land use plan mentions that "[c]onversion of many portions of [the peninsula] seems likely, given a lesser port presence in the downtown area, and development of Brownfield projects such as Magnolia".
Johns Island and James Island.
The final two regions of Charleston are a bit harder to analyze, since their Census tracts overlap both Charleston and other developed areas even more egregiously than in the above regions, but I can discuss them briefly here.
If I'm at all right in how I've been allocating non-Hispanic white growth by region, then something like a quarter of the growth has come from Johns Island and James Island. According to the website "Charleston Watch", the city's growth and annexation efforts have faced local resistance in both areas. Their descriptions are too interesting not to quote in full:
In James Island:"the City of Charleston has been aggressively annexing. Residents of James Island who remain in the unincorporated area attemped to create a Town of James Island but the City took legal action and the town was disallowed. Changes were initiated in Columbia and with the legal impediments removed, residents again voted to form a town. And the City of Charleston has again vowed to stop it. And it did. An effort is again being made to legally incorporate."
In Johns Island: "Johns Island is a sort of battle ground - on one side are the proponents of growth and home construction, on the other side are conservationists who wish to see the rural ambience of Johns Island preserved. The battle line is distinctly drawn by the County-determined Urban Growth Boundary (UGB)...The City of Charleston, which has been aggressively annexing property on James Island states that it will respect the UGB and not annex properties on the rural side of the unincorporated County areas."
The city's land use plan describes James Island as "the most 'built-out' of Charleston’s suburban areas [and so] it does not have as many new developments over the past decade". Indeed, Charleston city records only 186 housing permits issued on James Island from 2009-2013, the least of any region, although there was significant total and non-Hispanic white growth in James Island's Census tracts, especially the peripheral tract 20.03. (City estimates have the total population on James Island growing from 12,741 in 2000 to 18,589 in 2013.)
Charleston also seems to be developing at least "its" side of the UGB on Johns Island (the city's circa-2010 land use plan notes that "Johns Island has seen a great number of new developments approved in the past decade, although the recent economic down turn has affected them all"): 670 housing permits were issued there from 2009-2013, and the population in city limits grew from 1,676 in 2000 to 5,933 in 2013. Both are small fractions of the population of Johns Island's Census tracts (although a much smaller fraction in 2013), so I am not sure how to allocate the demographic breakdowns here. Either way, all of Johns Island is part of Charleston's periphery.
Political Consequences: Representation Lags Demographics.
A question that deserves a much longer answer: What are the effects of Charleston's demographic changes on the city's local politics?
I've noticed several times that representation lags demographics--that is, an area's political representation takes time to reflect population changes. Ferguson, Missouri famously has a white Mayor and nearly-all-white city council despite a rapidly-growing African-American majority in percentage terms, presumably reflecting the demographics of several decades ago. Conversely, several urban areas still have African-American political structures even as the population has shifted Hispanic/Latino.
Charleston's representation is also lagging its demographics, although perhaps just by a combination of chance and federal regulations. The city is only 24% African-American, but five of its twelve council districts--2, 3, 4, 6, and 7--are represented by African-Americans, which is the same split as before redistricting but down from a 6-6 split "a decade ago", according to this article, by Robert Behre, from the "Post and Courier".
Here is the current city council map:
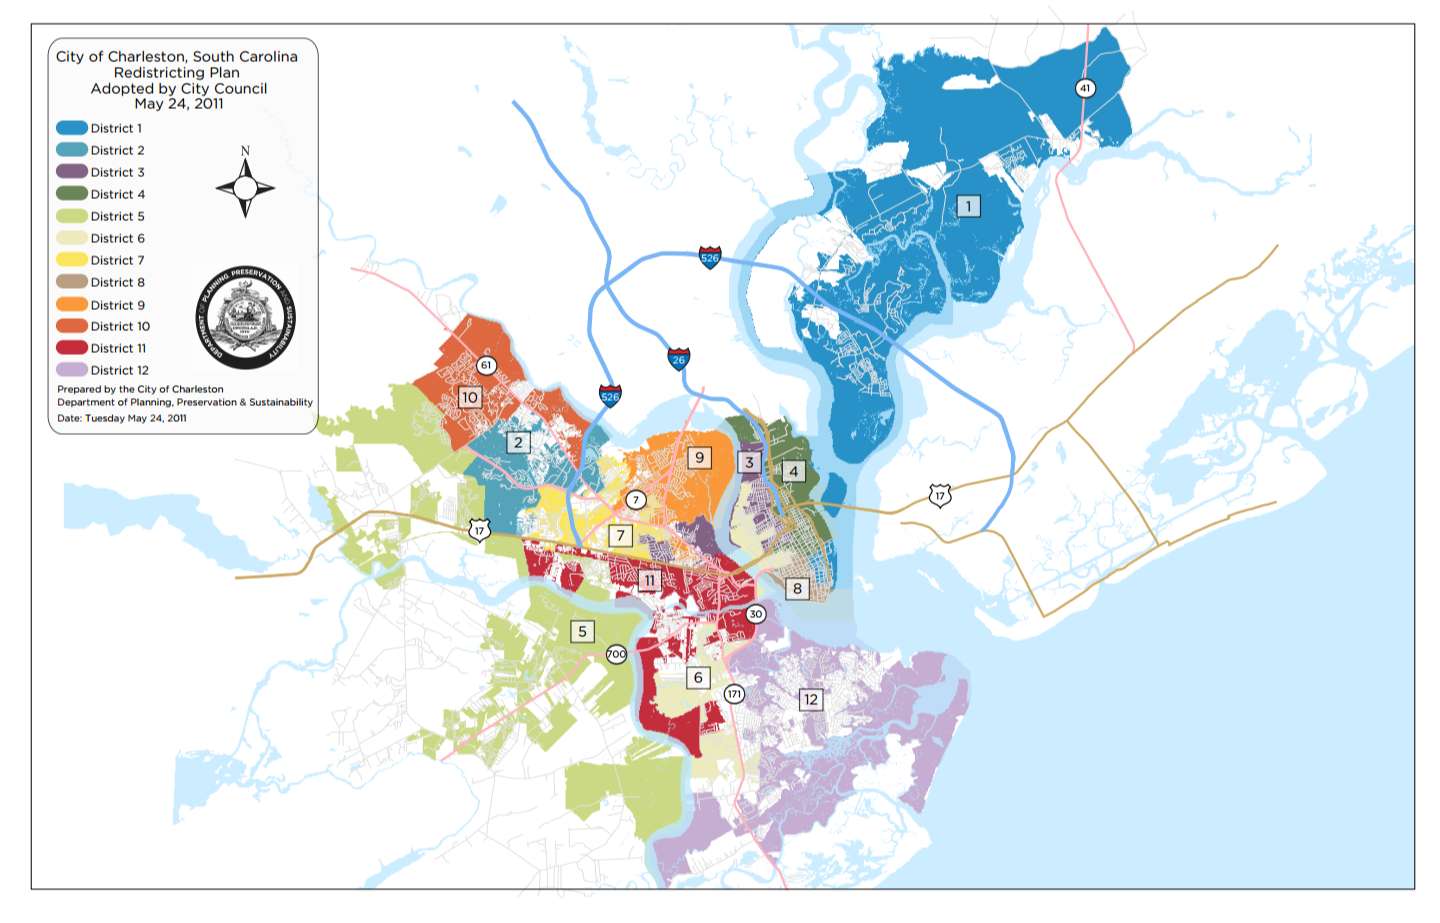
(District 5 might be one of my favorite districts anywhere, perhaps rivaled by District 6 and its use of water/touch point contiguity.)
According to Marc Knapp's article from "The Nerve", "the adopted plan has three majority/minority council districts (Districts 3, 4 and 7) and two districts in which minorities have significant representation (District 6 with about 25 percent and District 9 with 23.9 percent minority representation)." That the districts quickly drop from majority-minority to "significantly" 25% minority might give you some sense of how segregated Charleston is, incidentally, although the "Post and Courier" redistricting article below references "increased integration in neighborhoods".
The "Post and Courier" article also pointed out that Charleston had to get approval from the Justice Department for its new map under the VRA, which might help explain why the map contorts to connect Districts 3 and 6 to the peninsula. District 6 is currently represented by former Mayoral candidate Dudley Gregorie, who won easily. I don't think the supposedly minority-influence District 9 had an African-American candidate in its last election, but in District 2, an African-American candidate, Rodney Williams, beat a white incumbent, Blake Hallman by about 11 points (see previous link).
Without (apparently) strong candidates like Gregorie and Williams, there's certainly no reason to assume that Charleston's African-American population will continue to be over-represented on its council, although it will be interesting to watch. (I can't imagine there are very many areas that are almost entirely white and African-American where African-Americans are consistently politically over-represented.)
Notes On Sources.
Census tract demographics are from the 2000 Census SF1 sample and the 2013 American Community Survey 5-year estimates. (Code to be posted.) My references to "city estimates" for population and housing permits are from city documents here, here, here, and here.
Note:I originally used Census 2000 SF3 numbers, but decided to change it to the broader SF3 sample. Differences are very minimal, though.