Introduction: Why Incarceration Rates?
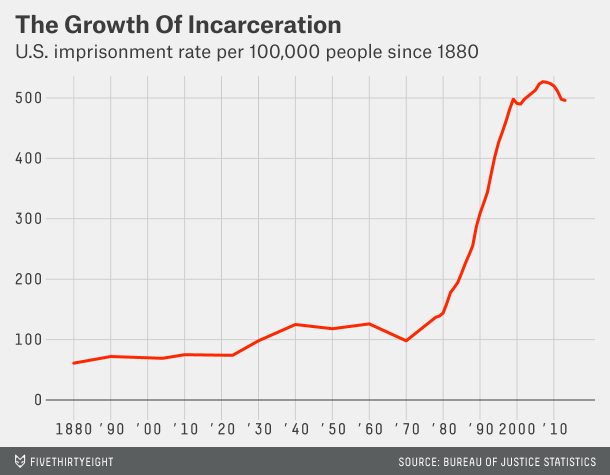
If you have been following any of the discussions of U.S. criminal justice reform then you have probably seen some version of this chart of American incarceration rates over time:
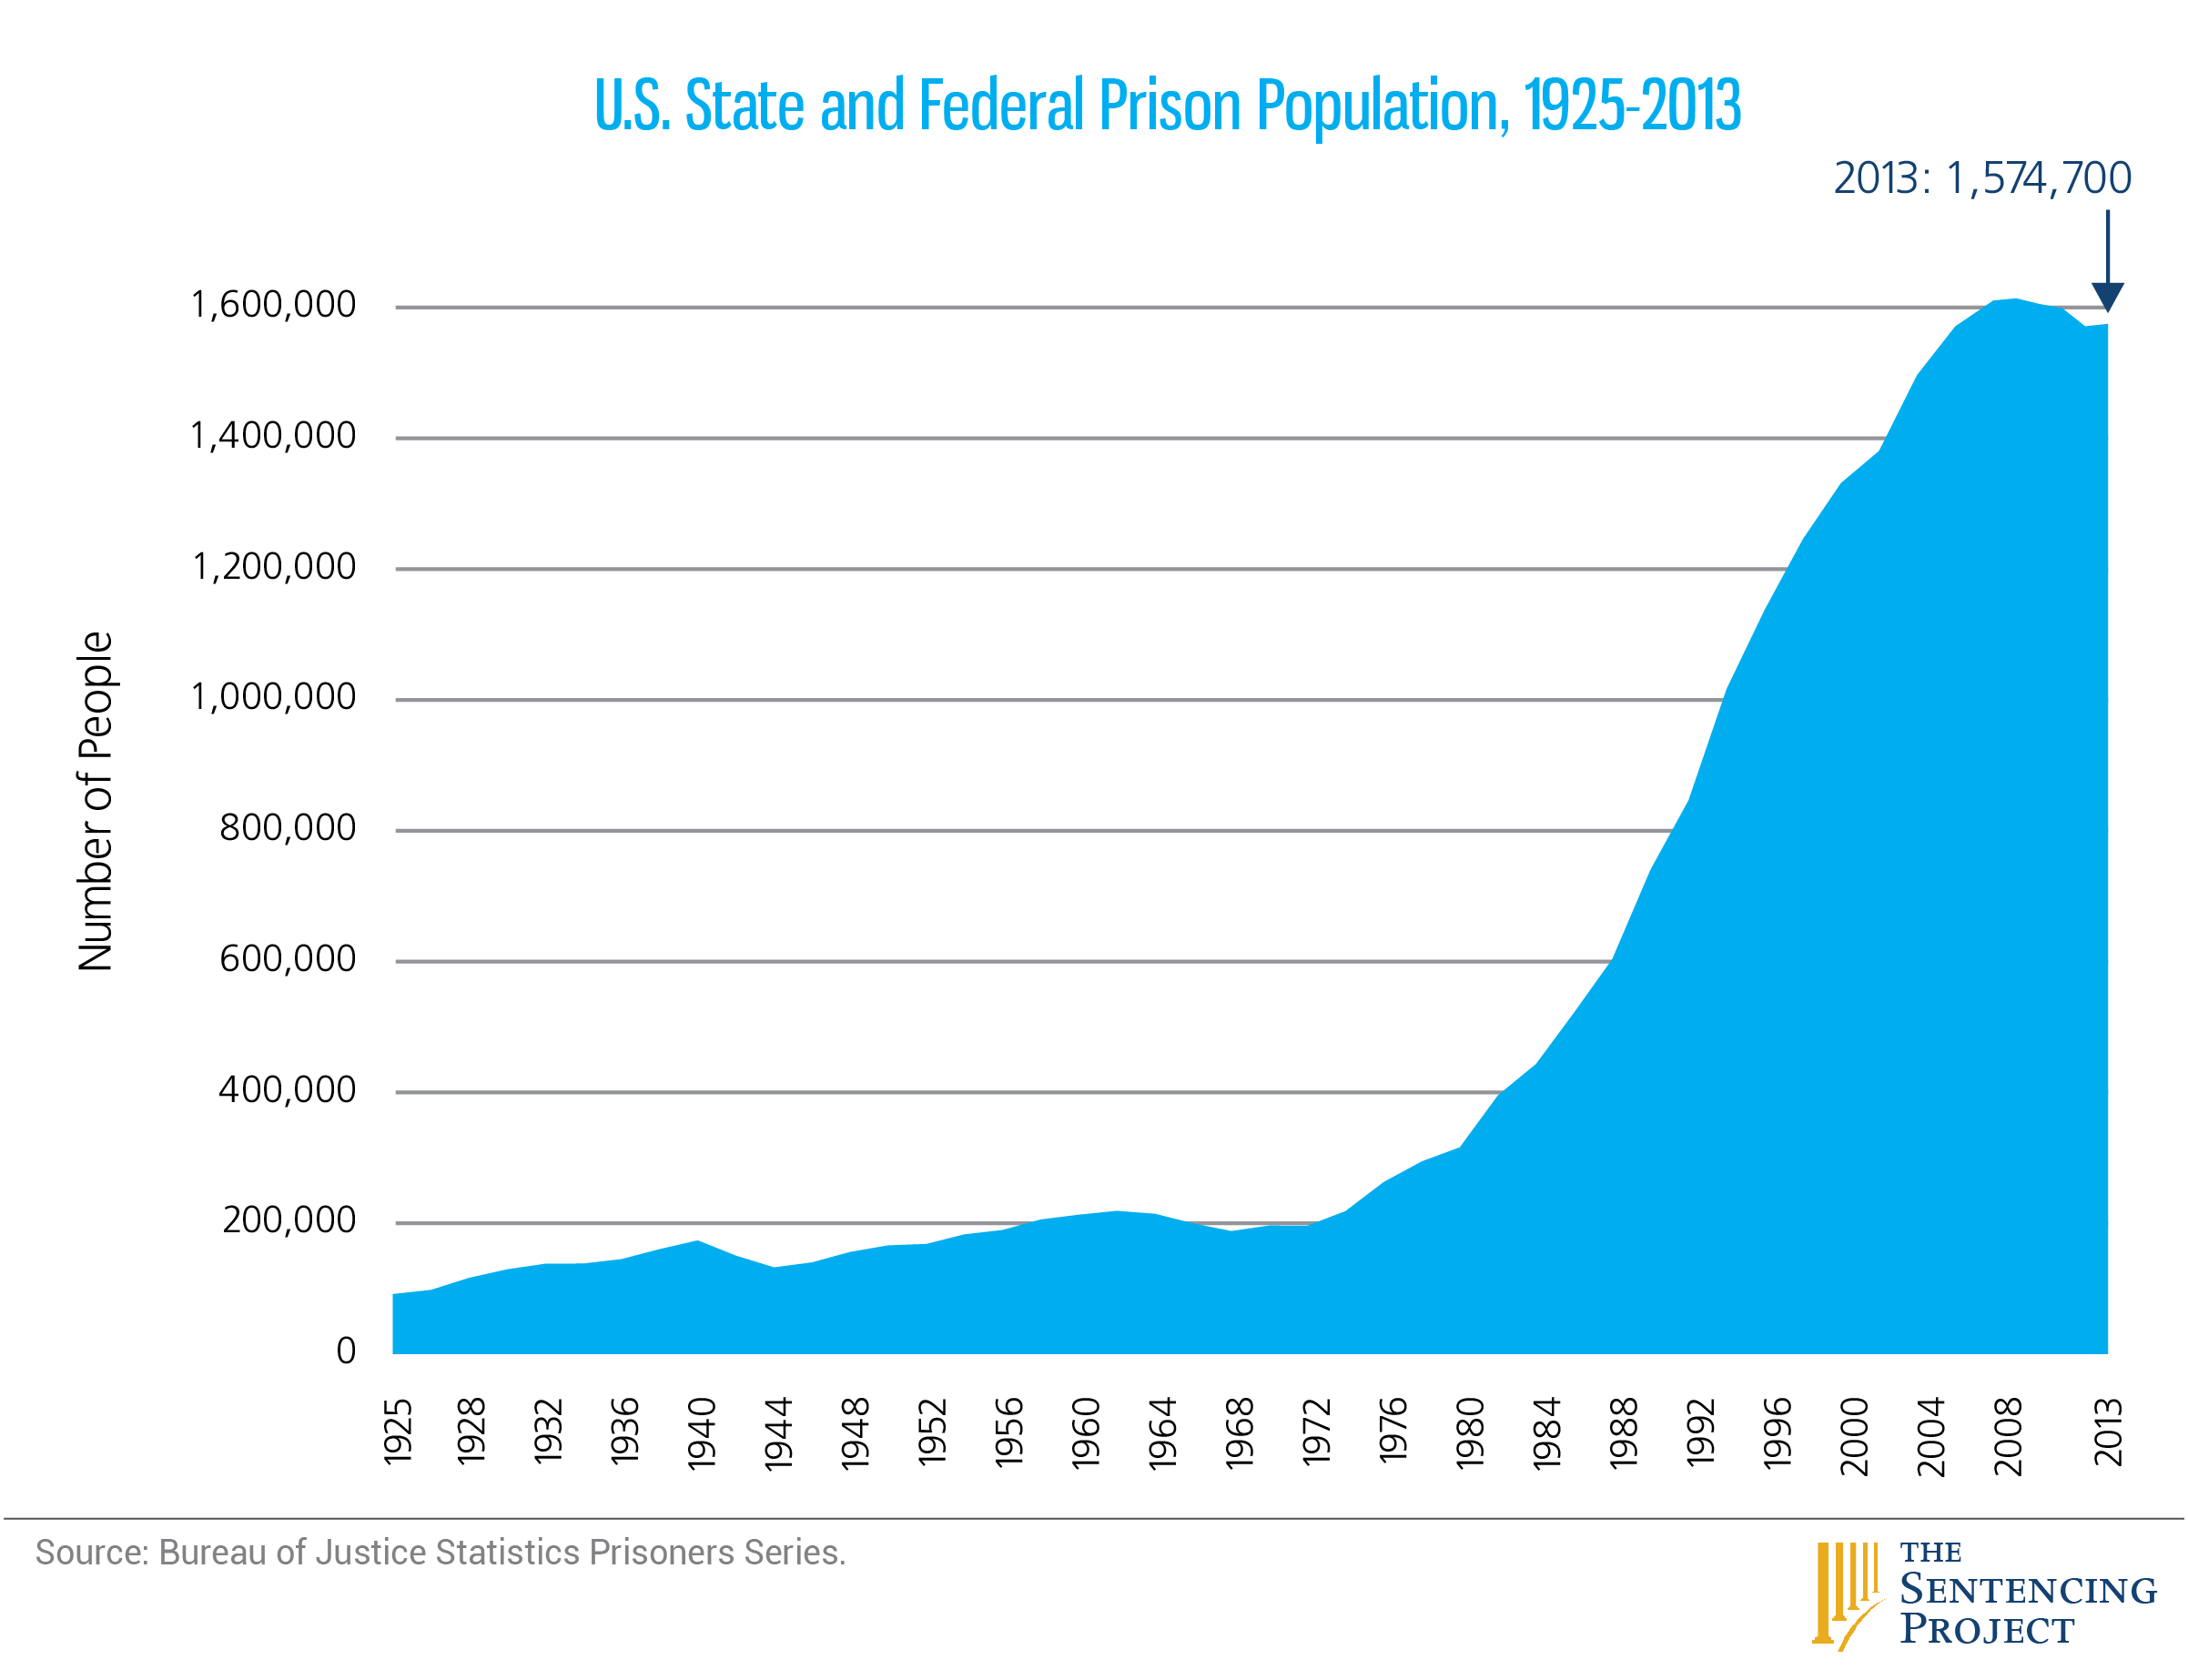
Or maybe you've seen this one, of American prison populations over time (originally from here:
They're certainly dramatic statistics, but to me (after spending some time reading about these things) they bring to mind a simple question: Why do we focus so much on incarceration rates, or on current prison populations, at all?
A country's incarceration rate is the percentage of its population currently serving a prison term; technically something like the sum over X of people admitted to terms of length X at most X days ago, divided by the population. An incarceration rate or prison population calculated today would aggregate together today's small drug offenders and drunk drivers along with convicted murderers from a decade ago, as long as they were all still in prison right now. In other words, they're snapshots: Measures of the "stock" not the "flow", as they say.
But there is no stock of incarcerated people. The people incarcerated today won't all be incarcerated tomorrow, and quite a few of them won't be incarcerated in a year or two. People move in and out of prisons, and convicted felons face a lifetime of consequences even when released. Because of this, focusing on incarceration rates and current prison populations can distort totals and distributions: The population incarcerated at least once in their lives is obviously far larger than the population incarcerated at any given time. (From Prison Policy, an extreme example by comparison: "almost 12 million people cycle through local jails each year", even though there are only about 700,000 people in local jails at any given time. They might mean 12 million unique admissions to local jails, though.) Offenses which tend to lead to longer prison terms, like murder, by definition account for a larger share of of the population incarcerated today than of the cumulative population incarcerated at some point.
For a visual analogy of how snapshot measures can distort cumulative totals and distributions, consider the simple diagram below. It has three red rectangles and ten blue rectangles, but any "snapshot" would show three red rectangles and two blue rectangles. Without looking cumulatively, you wouldn't realize how many blue rectangles there are:
That's an extreme example, but murder offenses account for 12.2% of state prisoners in Prison Policy's snapshot chart and drug offenses account for 17.4%, while the number of people admitted at some point for murder is probably a considerably smaller fraction of the number of people admitted at some point for drug offenses. (Although I'll note that Pfaff's paper, linked to below, says that 2000-2012 unique drug offenders were a similar percentage of unique offenders as the prison population would suggest.) In the same way, comparing two snapshot measures like incarceration rates can distort what kinds of changes happened.
To better understand the ways different policies affect real people, we would presumably rather study the lifetime risk of incarceration than the incarceration rate or the prison population: the population incarcerated at least once in their lives, not the population incarcerated at any given time. Unfortunately the latter is the dramatic statistic we have (perhaps in part because current prisoners are relatively easy to count, being in prison, and matching people across prison terms presents various logistical problems although it's done anyway) and there have been many impressive statistical projects trying to explain the effects of this or that factor on incarceration rates or prison populations as if they were the most relevant and meaningful numbers instead of the most available one.
Neal and Rick's Paper.
One of these statistical projects is a 2013 paper by Derek Neal and Armin Rick, "The Prison Boom And The Lack Of Black Progress After Smith And Welch". They combined arrest data from the Uniform Crime Reports program (UCR) along with offender-level data on admissions and terms from the National Corrections Reporting Program (NCRP) for a subset of states they considered internally and externally reliable: California, Colorado, Michigan, New Jersey, North Dakota, South Carolina, Washington, and Wisconsin. Aggregating offenses into fourteen categories, Neal and Rick looked at the percentage of people arrested for an offense who ended up serving terms of different lengths before release or parole as a proxy for sentencing harshness (see page 23 for their description of the various assumptions and caveats). Following tradition, they constructed a model to measure the effects of these sentencing changes on prison populations over time.
For some reason Neal and Rick take issue with other scholars like John Pfaff, who separate sentencing harshness into different concepts: the probability a person who is arrested is sent to prison, and the probability a person sent to prison serves for a particular amount of time. I do not really understand this dispute; as far as I can tell it is basically a semantic distinction: P(Serving for X Years | Arrest) = P(Serving for X Years | Admission to Prison) * P(Admission to Prison | Arrest).
Disclosure, I suppose: I've talked with John Pfaff and his admissions-focused work has definitely framed my thinking. In particular, his recent "The War On Drugs And Prison Growth: Limited Importance, Limited Legislative Options" covers some similar ground to this piece, although focusing on a different time period and not necessarily with the same conclusion.
Charting The Growth Of Incarceration Using Admissions, Not Rates.
I thought Neal and Rick's data on arrests, prison admissions, and time served, along with the different measures of severity, were interesting independently of how they might affect incarceration rates, so I put them into the below chart and table. Specifically, the numbers are taken from tables 7a-7c. (Unfortunately 1985 is a few years after what we now see as the period of sustained incarceration growth, but that's the starting date they use.)
The below chart has arrests and admissions for the checked offenses in the Neal/Rick
states, cumulatively (in the table) and over time (in the stacked area chart). You can check or uncheck offenses to look at subsets.
To hopefully satisfy everyone involved in the aforementioned dispute on measuring sentencing severity, I've provided three different totals in the table along with "reality": "If Time Served Per Admission Constant", which shows the cumulative results if the percentage of people admitted to prison each year served the same distribution of terms as in 1985; "If Admissions Per Arrest Constant", which shows the results if the percentage of people arrested who were admitted to prison stayed the same as in 1985; and "If Both Constant", which fixes both admissions per arrest and time served per admission.
All figures are in thousands of instances, as of now. Since I am taking Neal and Rick's rounded numbers and doing calculations with them, and then rounding them again in the chart and table, totals should be considered somewhat approximate and might not sum as expected.
(I should note that the chart is a bit of an abstraction, since I used D3 to fit a "Cardinal spline" through the annual totals. I doubt day-to-day arrests and admissions would look exactly like this.)
Immediate Takeaways.
First of all, there have been a lot of arrests, 58 million or so over the 15 years--of course that doesn't mean that 58 million distinct people were arrested, far from it. Despite the large number of arrests and the growth of "mass incarceration", there does not seem to have been a significant boom in arrests across these states. (Caveat from page 21: "Drug arrests in our NCRP states remain more than 50 percent above 1985 levels throughout the 2000s, but for the nation as a whole, drug arrests were at least double their 1985 levels for most of the 2000s. Most of this gap reflects the fact that drug arrests in California remained roughly flat from 1994 to 2002, and California accounts for a significant fraction of the arrests in our eight-state sample.")
Second, there were a lot more arrests than prison admissions. As you can see, you almost literally can't graph them on the same scale. In absolute terms, for nearly every offense, only a pretty small percentage of arrests seem to result in a new prison term, and this was true throughout the period. The number of new prison terms for aggravated assault was usually about 3% or 4% of the number of arrests for aggravated assault, for example.
Despite this, because the numbers are so large, and because increases accumulate over time, even relatively marginal changes in the percentage of arrested offenders who were apparently sentenced to prison terms can have consequences that are anything but marginal, as we'll see below.
Fnally, the considerable majority (about two-thirds) of prison admissions result in terms of 0-2 years before release or parole. Long sentences did become more likely depending on which measure you use, but this affected relatively few people compared to the growth in short sentences. Again, anything to do with longer sentences will have a disproportionate effect on the incarceration rate, but much of the story of American incarceration seems to remain people serving relatively short terms.
Breaking Down The "Extra" Admissions
These eight states recorded about 1.23 million new prison admissions from 1985 to 2000. There would have been about 780,000 if admissions per arrest were at constant at 1985 levels for each offense, which means that there were something like 443,000 "extra" prison admissions. Of course that doesn't mean that 443,000 distinct "extra" people went to prison: that would only follow if everyone went to prison at most once, which we know is false. Still, it is something like a start.
I would break those 443,000 "extra" prison admissions down as follows (again, consider all totals approximate given various rounding issues):
- The extent to which the "War On Drugs" "explains" "mass incarceration" is a heavily contested topic, as are the definitions of any of those things, I imagine. Based on the Neal/Rick paper, there were about 215,000 "extra admissions" from drug offenses, about half of the total number of "extra admissions", with 133,000 from "drug trafficking" and 82,000 from "drug possession/use". Does that mean that about half of "mass incarceration" is "explained" by the "War On Drugs"? Maybe. It's probably an over-estimate: some of those admissions were pre-textual or plea bargains. It doesn't necessarily explain about half of the increased lifetime risk of incarceration (since some of the people who were admitted to "extra" drug terms had been incarcerated before, or would have been admitted for something else even without the increased focus on drugs). Even if drug offenses explain about half of the increase in admissions over this time period, they probably explain less of the increase in the incarceration rate, since the sentences are shorter. Finally, it might only apply to this particular time period, as Pfaff finds somewhat different results looking at 2000-2012 in the above paper.
- By the same criteria, there were 80,000 "extra admissions" from "other crimes", about one-fifth or one-sixth of the total. Since this one category includes about half of all arrests, it presumably covers misdemeanors along with a grab bag of miscellanious felonies. That probably means that looking at a single admissions to arrests ratio over time is even more suspect for "other crimes" than it is for the other categories. Still, there was a large increase in "other crimes" admissions over time, and it has to explained somehow. My guess based on other states is that a lot of them were from traffic/DUI offenses, weapons charges, or law enforcement process stuff (escape, resisting arrest, failure to appear). Between these two bullet points, perhaps two-thirds of "extra admissions" were for drug offenses or miscellanious crimes, leaving only about a third for more conventional property or violent crimes.
- There were 94,000 "extra admissions" from property crimes. Most of these were from the "Burglary" and "Larceny/Theft" categories (36,000 and 32,000 respectively), along with "Motor Vehicle Theft" (17,000), "White Collar Crime" (8,000) and "Other Property" (2,000). Once again, this is because arrests for property crimes more or less declined from 1989 to 2000 even without adjusting for population growth, while prison admissions for property crimes grew slightly. In absolute terms the changes were small (for these property offenses new prison admissions as a share of arrests went from around 2% to around 3.5%) but had a larger impact over time.
- There were 36,000 "extra admissions" from violent crimes, around eight percent of the total, nearly half of them classified as "Robbery" (17,000), along with "Murder and Homicide" (9,000) and "Other Assault" (9,000). There were only minimal "extra admissions" from "Aggravated Assault" or "Forcible Rape". Strikingly, Pfaff writes that violent offenses account for 52% of the growth in snapshot prison populations between 1980 and 2009, although that's a different metric and time period.
- Finally, there were 17,000 "extra admissions" from "Other Sex Crimes".
Conclusion.
My goal for this piece was to provide a different way of looking at the information gathered by Neal and Rick, and hopefully to encourage some different ways of thinking about prison and incarceration statistics. I think it's important to remember what we don't, or can't, know from those statistics.
Statistics like annual arrests and admissions are provided by law enforcement institutions themselves and almost certainly have holes, biases, and so on that are very difficult to check externally. Just a few weeks ago, Ben Poston, Joel Rubin and Anthony Pesce at the Los Angeles Times published a story about how the LAPD had "misclassified an estimated 14,000 serious assaults as minor offenses in a recent eight-year period".
Even putting aside (and it shouldn't be put aside), these are summaries, not indvidual incident reports or, even more impossibly, knowing what actually happened in each case. For example, if these numbers are right, then arrests for burglary dropped quite a bit from 1989 to 2000 in these states, while prison admissions for burglary dropped by a much smaller amount. Is that because police made fewer false arrests? Or because police made fewer arrests in real but marginal burglary cases unlikely to result in incarceration? Or because police arrested the exact same kinds of burglars, but fewer people were committing burglary, and courts and prosecutors became more aggressive? It's basically impossible to know from these numbers, and would probably require access to internal data along with interviews and so on.
Similarly, I think that understanding the lifetime risk of incarceration--the total number of people incarcerated at all, at some point--is perhaps the most fundamental question in this area. I wish I could chart its history, but I don't know if that's even possible with the limitations of these statistics. The incarceration rate and snapshot totals of people currently in prison are obviously an undercount of how many people have been in prison at least once. Just as obviously, cumulative prison admissions are an overcount, since people can be admitted to prison more than once, and maybe a significant overcount. Pfaff's paper found that, in his selected "Tier A" states from 2000-2012 (after the NCRP introduced inmate-level identifiers), 2,755,790 prison admissions came from 1,442,810 unique offenders, and 764,162 prison admissions came from 526,893 in his "Tier B" states. Unfortunately I do not think any publically-available information allows similar analysis to be done over the 1980-2000 incarceration growth period, although privately-available information might.
Finally, I don't want to impugn the work of trying to figure out how different factors affect incarceration rates and snapshots of the prison population. The incarceration rate is a famous number, an interesting puzzle, and directly relevant to some practical questions (like: how many prison cells do we need right now?). You could argue that not all prison admissions should be treated equally, that longer sentences cause more severe harm and deserve greater weight. Maybe so, but I think it's probably best to disaggregate the issues. "Who gets sent to prison?" and "How long are people staying in prison?" are distinct questions analytically, practically, and morally.
Notes.
I first saw a reference to Neal and Rick's article in Ta-Nehisi Coates' recent "The Black Family In The Age Of Mass Incarceration". As I said above, John Pfaff was kind enough to speak to me several times and I certainly recommend reading his research. I believe I used Tabula to extract the information from Neal and Rick's PDF tables. Also as I said above, I've been reading about prison statistics for some time, and unfortunately it's probably not possible for me to cite everything I've read, but this is a new area for me and I'd welcome feedback, comments, etc. even more than usual at @xenocryptsite.